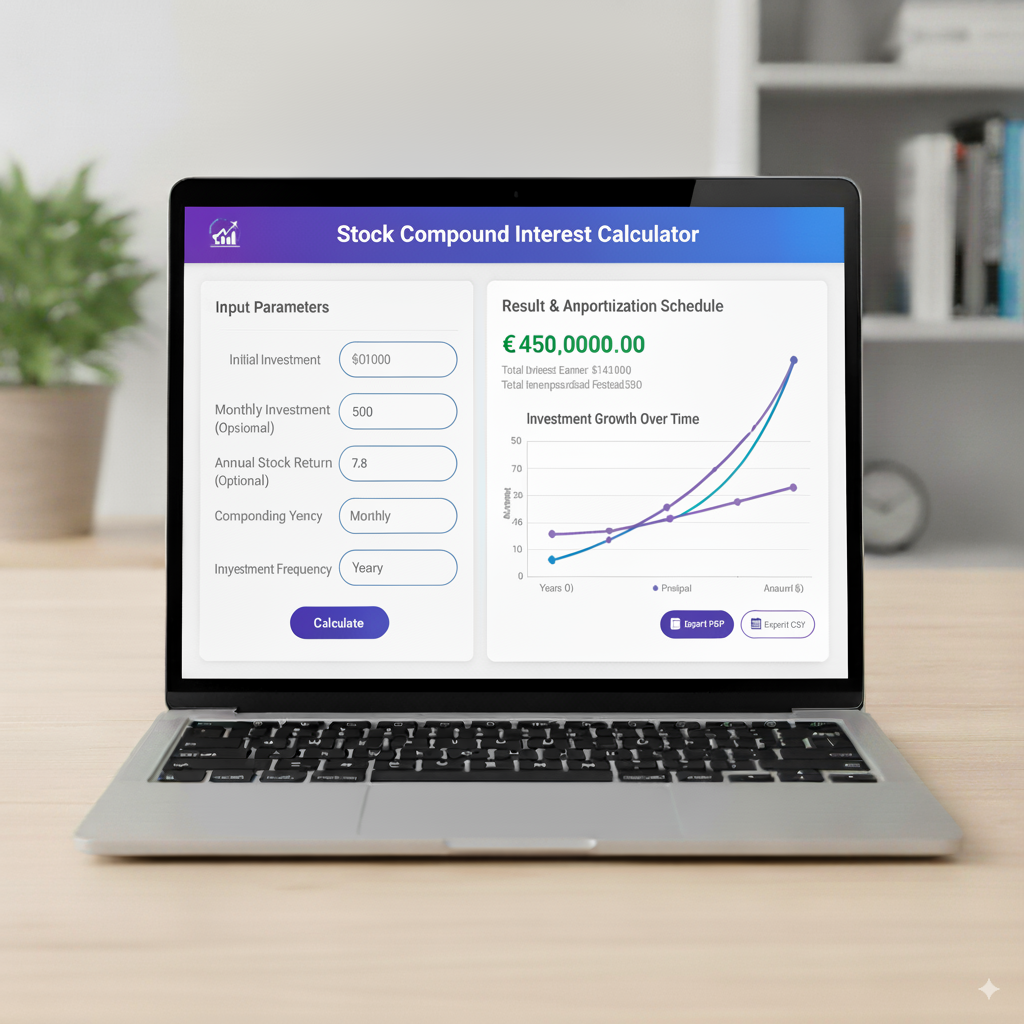
Stock Compound Interest Calculator
Calculate how stock investments can grow with compounding
Investment Growth Breakdown
Introduction
Ever seen a small investment quietly turn into a life-changing sum over the years? That’s the magic of compounding at work. With stocks, compounding isn’t about “interest” like you’d get from a bank account—it’s about total return, blending share price growth with reinvested dividends. A Stock Compound Interest Calculator helps you map out that growth, turning guesses into solid plans.
This guide dives into how compounding works for stocks, explains how calculators model it, shows you how to build your own in Excel for full control, compares popular tools, and lays out real-world scenarios to make the math feel real. No fluff—just the stuff you need to know.
What Investors Mean by “Compound Interest” When They Say Stocks
When folks toss around “compound interest” for stocks, they’re really talking about compounding growth. It’s the process where your returns start making their own returns: dividends buy more shares, which churn out more dividends, and rising stock prices boost the value of those extra shares. Over time, this creates a snowball effect that can lead to exponential growth.
Unlike a bank’s fixed-rate savings account, stock compounding comes from two moving parts: capital gains (when stock prices climb) and dividend reinvestment (using dividends to buy more shares). A stock compound interest calculator wraps both into one clear number, showing you the total return effect without the guesswork.
The Math Behind a Stock Compounding Calculator – Core Concepts
For a basic model, a calculator needs three key pieces:
- Initial Investment (P): The cash you start with.
- Annualized Total Return (r): This blends dividends and price growth, written as a decimal.
- Time Horizon (t): How many years you’re investing for.
The simple formula is:
A=P×(1+r)t A = P \times (1 + r)^t A=P×(1+r)t
This assumes your returns compound annually at a steady average rate. In reality, stock returns bounce around, and dividends come in periodically, but this formula gives a clear, intuitive snapshot of how your money multiplies over time.
For a more realistic picture, calculators often include yearly cash flows (like extra contributions), dividend yields, dividend growth rates, or even year-by-year return estimates to build a detailed balance. Ultimately, every solid stock compound interest calculator turns those moving parts into a future portfolio value.
Difference Between Stock Compounding and Bank Interest Compounding
The big difference is predictability and where the returns come from. Bank interest is usually steady and follows a set schedule (daily, monthly, or yearly). Stocks? They’re a wilder ride—returns come from unpredictable price swings and dividends that can shift.
A stock compound interest calculator uses expected or historical annualized returns (like CAGR, or Compound Annual Growth Rate) instead of a guaranteed rate. The result is a best-guess projection, not a sure thing like a bank account’s promise.
Why a Stock Compound Interest Calculator is Useful for Real Investors
This tool is a game-changer for everyday investors because it:
- Sets realistic goals: Dreaming of ₹1 crore in 20 years? The calculator shows what returns and contributions you’ll need to get there.
- Breaks down growth: It splits out capital gains versus reinvested dividends, so you see what’s driving your portfolio.
- Shows time’s power: Tiny changes in returns or years can lead to massive differences—time is your secret weapon.
- Guides decisions: Should you reinvest dividends or take cash? Stick with index funds or chase dividend stocks? Add more savings or go lump-sum? The calculator helps you choose.
Seeing the numbers can spark a shift—people tend to save more and hold investments longer when they see compounding’s potential laid out.
Building a Practical Stock Compound Interest Calculator – Inputs and Outputs
A solid stock calculator should let you plug in:
- Initial Investment: Your starting lump sum.
- Periodic Contribution: Monthly or yearly additions to your portfolio.
- Expected Annual Return: Your estimated CAGR (total return).
- Dividend Yield: If you want to track dividends separately.
- Dividend Growth Rate: If you expect dividend payouts to grow.
- Investment Timeframe: How many years you’re in for.
- Reinvestment Toggle: Whether dividends get reinvested or taken as cash.
- Taxes and Fees (optional): For real-world accuracy.
- Annual Volatility (advanced): For modeling different scenarios.
The outputs should give you:
- Final Portfolio Value: Your total return.
- Contributions vs Gains: How much came from your pocket versus profits.
- Year-by-Year Balance Table: A clear growth path.
- Annualized Return (CAGR): For comparing investments.
- Dividend Income Projection: Reinvested or taken as cash.
- Visual Growth Curve: To make the numbers pop.
This setup gives you insights you can actually act on, not just a single number.
Example: How the Calculator Models Simple Stock Compounding
Imagine you start with $10,000, add $200 monthly, and expect an 8% average annual return over 30 years. A stock compound interest calculator will:
- Turn monthly contributions into a yearly schedule (or compound monthly, depending on the model).
- Apply the 8% return to each year’s starting balance and contributions.
- Reinvest dividends if you choose that option.
- Show you the final value, revealing how your $10,000 plus contributions grows into a much bigger pile.
Roughly, with 8% over 30 years and $200 monthly, your final value will be several times your contributions, since those additions start compounding the moment they’re invested.
Add to chat
StockCompoundInterestCalculator.js
javascript
Edit in files•Show inline
Total Return vs CAGR – The Two Numbers Investors Care About
Total return is the full growth of your investment over time—your actual dollar profit. CAGR (Compound Annual Growth Rate) is the smoothed-out yearly rate that would get you from your starting point to your final value if growth were steady.
Calculators often show both:
- Total Return: Tells you how much money you made.
- CAGR: Gives you a percentage to compare different investments.
For example, if $10,000 grows to $80,000 in 25 years, the CAGR is about 8.7%—a number you can plug into your retirement plan to see if it’s on track.
Modeling Reinvested Dividends – The Real Compounding Engine for Many Stocks
Dividends are a big deal. A stock with so-so price growth but solid reinvested dividends can outshine a no-dividend stock over decades.
A calculator handling dividends will:
- Take the dividend yield and how often it’s paid.
- Reinvest the dividend at the stock’s market price for that period (or an average price).
- Add those new shares to your balance, which then churn out more dividends later.
This snowball effect is the heart of “dividend compounding.” If you use a dividend reinvestment plan (DRIP), the calculator mimics real life: small, regular share purchases that add up big over time.
Using Excel to Create a Stock Compound Interest Calculator (Step-by-Step)
If you want total control, Excel’s your friend. Here’s how to build a simple stock calculator:
- Set Up Columns: Year, Starting Balance, Contribution (yearly total), Dividend (if included), Return (price appreciation), Interest/Return Earned, Ending Balance.
- Year 1 Starting Balance: Your initial investment.
- Contribution Column: Your annual contribution (or 0 for lump-sum only).
- Apply Annual Return: Return Earned = (Starting Balance + Contribution) × Annual Return Rate.
- Ending Balance: Starting Balance + Contribution + Return Earned.
- Next Year’s Starting Balance: Last year’s Ending Balance.
For dividends, calculate Dividend Earned = (Starting Balance + Contribution) × Dividend Yield, then add it to the Ending Balance if reinvested. Use absolute cell references for rates and drag the formulas down for your time horizon. This creates a year-by-year schedule you can graph or export.
Advanced Modeling: Random Returns and Monte Carlo Simulation
Real life is messy. Advanced calculators use Monte Carlo simulations to model thousands of possible futures based on historical volatility. Here’s how:
- Pick an expected return and volatility (standard deviation).
- Generate random yearly returns based on a normal (or log-normal) distribution.
- Reinvest dividends as per your settings.
- Run the simulation thousands of times to get a range: median outcome, pessimistic (10th percentile), and optimistic (90th percentile).
Investors love this because it shows the risks and odds of hitting their targets—way more useful than a single “average” number.
How Fees and Taxes Change the Compounding Story
Even small fees—like expense ratios or brokerage commissions—and taxes on dividends or capital gains can eat into your compounding over decades. A 0.5–1% annual fee can knock years off your goals.
Calculators should let you subtract:
- Annual management fees or expense ratios.
- Dividend withholding taxes or local taxes on gains.
- Capital gains tax when you cash out (for post-tax scenarios).
After-tax compounding is what really hits your bank account, so always model taxes for a realistic plan.
Rebalancing and Compounding – Keeping Your Growth on Track
If you’ve got a portfolio with multiple stocks or funds, rebalancing keeps your asset mix in check but might mean selling winners. This can slow compounding on individual holdings but lowers overall risk. Some calculators model rebalancing to show the trade-off: slightly lower returns for a smoother ride.
Practical Scenarios: Three Investor Profiles Modeled with a Stock Compound Interest Calculator
- The Long-Game Indexer Starts with $20,000, adds $500 monthly to a low-cost index fund, expects 7% annual return, reinvests all distributions, 30-year horizon. Outcome: A hefty final portfolio with low volatility—a nearly hands-off win.
- The Dividend Reinvestor Starts with $10,000, no monthly additions, picks dividend aristocrats with a 3% yield and 5% annual dividend growth, 8% total return, 25-year horizon. Outcome: Dividends compound nicely, creating meaningful passive income.
- The Active Trader (Suboptimal Compounding) Starts with $50,000, trades often with a 6% average return but high fees and taxes, 20-year horizon. Outcome: Compounding takes a hit from costs; volatility leads to weaker results than the indexer.
These show how strategy, contributions, fees, and reinvestment shape your compounding results.
Common Mistakes People Make When Using Stock Compound Calculators
- Assuming past average returns will repeat exactly.
- Ignoring sequence-of-returns risk (bad early years can hurt long-term results).
- Forgetting to factor in inflation and taxes.
- Overlooking fees and trading costs.
- Treating the calculator’s output as a sure bet.
Use calculators to plan, not to predict the future.
Choosing the Right Expected Return to Plug In – Discipline and Realism
Wondering, “What return should I use?” For cautious planning, 4–7% real return (after inflation) is a solid range based on historical stock market data. Aggressive plans might use higher numbers, but that’s risky.
A smart approach:
- Start with a conservative base case (like 6–7% nominal).
- Run best- and worst-case scenarios (±2–3% annually).
- Use Monte Carlo for a range of probabilities instead of one fixed number.
This keeps your expectations grounded and your plan flexible.
When to Prefer Lump-Sum Compounding vs Regular Contributions
Lump-sum investing works great if you get a big chunk of cash and invest it right away—time in the market usually beats trying to time the market. Regular contributions (like SIPs or DRIPs) use dollar-cost averaging: you buy more shares when prices are low and fewer when they’re high, smoothing out your costs and boosting compounding. Calculators let you test both to match your cash flow.
Visualizing Results – Why Charts Matter
A year-by-year growth chart shows that “hockey stick” moment when compounding really takes off. Seeing the curve climb makes the math feel real and motivates you to stay invested instead of selling in a panic. Good calculators offer charts and downloadable tables to keep you inspired and organized.
Building Trust: Validating Calculator Outputs
To trust a calculator, always check it by:
- Running a simple example with known results (like fixed returns) to confirm the formula.
- Cross-checking with Excel or another tool.
- Making sure rate units (monthly vs. annual) are correct.
This avoids errors and makes your projections rock-solid, whether for personal planning or sharing with others.
Frequently Asked Things That Users Wonder About (Before the Formal FAQs)
Does compounding work if dividends are paid monthly vs quarterly? Yup—more frequent reinvestment gives a slight edge since you’re buying shares sooner.
Do stock splits affect compounding? Not really—splits increase your share count but lower the price per share, leaving your total value and compounding path unchanged (except maybe psychologically).
Is continuous compounding used for stocks? Not quite—stocks compound in discrete chunks (dividends, price moves), so calculators use real periods or Monte Carlo simulations, not continuous math.
FAQs – Tailored Specifically for the Keyword Stock Compound Interest Calculator
Final Thoughts – Compounding is Simple, but Planning is the Hard Part
Stock compounding isn’t about secret math—it’s about discipline. Keep adding contributions, reinvest dividends, cut fees and taxes, and stay invested through market ups and downs. A Stock Compound Interest Calculator is your roadmap, helping you plan, test scenarios, and prepare for different futures. With time, compounding rewards those who stick with it—and the calculator makes those rewards clear as day.